

Decoding flash floods with GeoAI in Vietnam’s Northern Highlands - Part 2: Modelling extremes and what the maps reveal
14/11/2025TN&MTFollowing the data-building and field-validation groundwork outlined in Part 1, this second installment, led by Le Nhu Nga and colleagues at the Institute of Mechanics, Vietnam Academy of Science and Technology, examines how three machine-learning models were tested against the complexities of Vietnam’s mountainous terrain. Each algorithm offered a different path to decoding the nonlinear interactions that drive flash-flood formation—yet the performance gap between them also reflected the physical realities of steep slopes, fractured bedrock, and highly variable extreme rainfall.
Three models, three algorithmic profiles
The research team evaluated three representative machine-learning algorithms:
XGBoost (eXtreme Gradient Boosting): A tree-boosting method well suited for nonlinear relationships, variable interactions, and noisy datasets.
MLP (Multilayer Perceptron): A feed-forward neural network capable of approximating complex nonlinear functions when provided with sufficiently large training data.
SVM (Support Vector Machine): A margin-based classifier effective for moderate-sized, low-noise datasets, but often limited in high-dimensional or strongly nonlinear settings.
Validation results showed clear performance differences:
- XGBoost achieved the highest accuracy with a Kappa coefficient of 0.87, followed by MLP at 0.85, while SVM lagged at 0.71.
- Field verification confirmed that actual flood traces matched the high-risk areas predicted by the models. The differences reflected each algorithm’s inherent strengths: XGBoost and MLP captured nonlinear and interacting factors more effectively in the steep, dissected terrain with highly variable extreme rainfall, whereas SVM struggled with the problem’s dimensionality and nonlinear complexity.

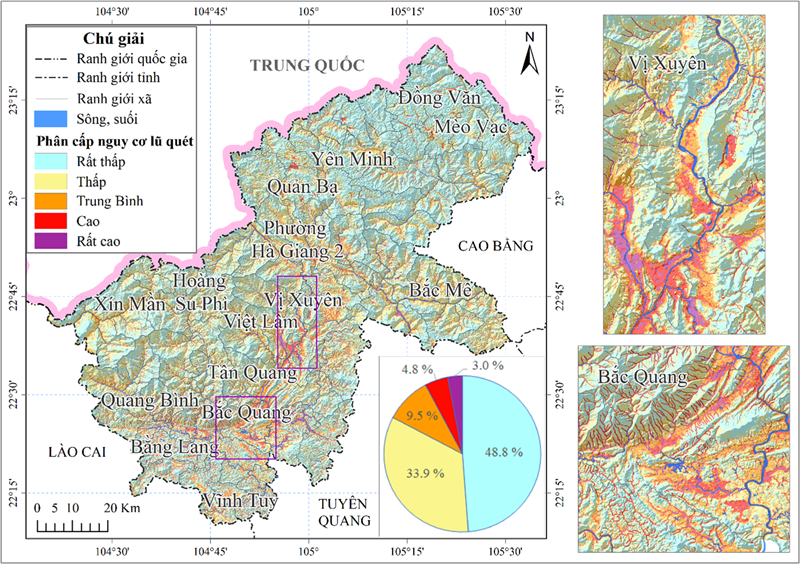
Flash flood risk distribution according to the XGBoost model: (a) entire study area, (b) detailed view of Vi Xuyen commune, (c) detailed view of Quang Binh commune
Hazard mapping: Five risk levels shaped by terrain
The XGBoost-based hazard map divides the study area into five classes—very low, low, moderate, high, and very high—with the following distribution: 48.8% – 33.9% – 9.5% – 4.8% – 3.0%.
In other words, 82.7% of the area falls within very low to low risk; 9.5% is moderate; and 7.8% is classified as high to very high. High-risk zones are concentrated along river channels and valley floors—areas shaped by V-shaped cross-sections, intense topographic dissection, and complex fault systems typical of the Hà Giang landscape.
Notable spatial patterns:
- Very low – low (82.7%): ridge lines, slopes, and elevated terrain with limited rainfall accumulation, resulting in low flash-flood potential. However, localized debris-flow events may still occur due to slope failures or the collapse of natural dams.
- Moderate (9.5%): transitional areas between low- and high-accumulation zones. Typically unaffected by seasonal rainfall but vulnerable to extreme, infrequent storm events. These areas often host settlements, agriculture, and infrastructure because of their relatively favorable conditions.
- High – very high (7.8%, including 3.0% very high): concentrated along rivers and valley bottoms where surface runoff converges, frequently affected during the rainy season. Despite limited area, population density, economic activity, and infrastructure are often highest here—leading to elevated exposure and risk.
Commune-level patterns: Hotspots and “risk basins”
Zonal Statistics analysis showed that nearly all communes contain all five risk levels. The proportion of high + very high categories ranges from 1.4% to 21.7%.
Lowest-risk communes (high + very high <3.0%) include: Meo Vac, Lung Cu, Lung Phin, Sa Phin, Duong Thuong, Dong Van. At Sa Phin, Lung Phin, Meo Vac, Sung Mang, Pho Bang, Thang Mo, and Dong Van, very-high risk is negligible (<0.5%). These communes lie within the Dong Van Karst Plateau UNESCO Global Geopark, where highly permeable limestone reduces surface runoff and limits flash-flood formation.
Highest-risk communes (high + very high >10%) form a south–southeast arc across the study area: Tan Quang, Ngoc Duong, Xuan Giang, Tien Yen, Hung An, Tien Nguyen, Quang Binh, Dong Yen, Linh Ho, Vinh Tuy, Viet Lam, Bang Lang, Tan Trinh, Bang Hanh, Vi Xuyen, and Bac Quang. These lie along the Lo and Gam river corridors—densely populated, economically active, and among the region’s primary rainfall centers.
Examples from Table 1 include:
- Bac Quang: high 14.7%, very high 7.0%
- Vi Xuyen: high 14.0%, very high 6.4%
- Bang Hanh: high 12.1%, very high 7.9%
- Tan Trinh: high 12.0%, very high 7.7%
- Viet Lam: high 7.5%, very high 7.0%
- Linh Ho: high 9.5%, very high 4.6%
These figures reinforce a “risk boundary” along the two major river systems, where natural flood-convergence conditions intersect with concentrated settlement and infrastructure needs.
Methodological significance: From local pixels to hydrological units
A major contribution of this study is the use of catchment-based indices, rather than examining each grid cell in isolation as many earlier studies did. This approach reflects the physical mechanism of flash floods—events triggered upstream that accumulate and propagate energy through the drainage network.
Combined with the large training dataset (>11,000 labeled points), field flood traces, satellite/Google Maps imagery, and parameter optimization via GridSearchCV, the model achieved notably high accuracy (Kappa up to 0.87).
Although the technical paper does not list specific rankings from Permutation Importance or SHAP, the data structure suggests that slope, basin morphology, short-duration extreme rainfall, and land-cover/NDVI characteristics are among the dominant predictors.
From maps to policy: Applications for planning and early warning
The hazard map serves more than a spatial depiction. According to the authors, it provides scientific grounds to:
- Integrate disaster prevention and mitigation into socio-economic, sectoral, and land-use planning;
- Design and prioritize protective infrastructure (flood-release channels, riverbank stabilization, rescue routes) in high-risk zones;
- Develop early-warning bulletins, evacuation plans, and safety measures for communities;
- Support damage assessment and post-disaster recovery through baseline risk classification.
Communes where high + very high exceeds 10% should be prioritized for detailed sub-catchment assessments, additional protective works, or controlled relocation.
Moderate zones (9.5%), often where communities and production are situated, require risk-management protocols: regulating riparian land use, enforcing safety buffers, and implementing “soft” measures (warning systems, risk education, drills).
Very low – low zones may offer opportunities for relocating residents from more hazardous areas, subject to careful assessment of debris-flow hazards caused by landslides or natural-dam failures.
Limitations and future directions
The authors acknowledge several limitations: (1) current terrain data lacks the resolution needed to detect micro-topography (small gullies, local water-convergence pits) critical in narrow valleys; (2) while field verification was conducted (May 2024), it does not yet cover the entire region—further surveys are needed, especially in streamside settlements.
Future work requires higher-resolution DEMs (1:10,000–1:25,000), local expert consultation, and expansion to new administrative boundaries following recent commune mergers. The Google Colab/Drive workflow demonstrates that computational bottlenecks can be resolved without expensive hardware, an encouraging sign for scaling up.
Why XGBoost leads the pack
XGBoost outperformed the others due to: (1) strong capacity to model nonlinear relationships and interactions (e.g., between slope and 24–72–120-hour rainfall, or between NDVI and land-use type); (2) robustness to heterogeneous and noisy data; (3) iterative boosting that minimizes errors step by step; (4) compatibility with interpretability tools such as Permutation Importance and SHAP—essential for public-sector decision-making.
SVM, despite its strengths with standardized, moderate-dimensional datasets, performs poorly in environments with numerous features and complex nonlinear patterns characteristic of mountainous terrain.
MLP performed competitively, confirming its ability to approximate complex functions when supported by a large labeled dataset (>11,000 points).
A “living map”: From data to action
The study’s practical value lies in demonstrating that a hazard map is not a static snapshot but a dynamic, updatable tool. As seasonal rainfall datasets (from 34 automatic stations) lengthen and new satellite-derived NDVI images reflect changes in forest cover (logging, replanting, fire damage), the model can be retrained and the map re-generated—forming a low-cost GeoAI pipeline.
Local authorities can integrate the map into early-warning workflows: when 24–72–120-hour rainfall forecasts exceed thresholds, alerts can be activated based on the predefined commune risk levels.
From maps to safer livelihoods
The 7.8% high–very high risk area is not a predetermined fate.
With GeoAI-based hazard mapping, communities can reduce exposure (planning land-use changes), decrease vulnerability (reinforcing housing and critical infrastructure), and strengthen response capacity (warnings and evacuation).
The list of 16 hotspot communes effectively becomes an action map—guiding detailed surveys, priority investments, or planned relocation.
Conversely, the limestone-dominant communes of the Dong Van Karst Plateau illustrate how geological structure and permeability mitigate flash-flood formation—offering lessons for nature-based, ecosystem-informed solutions.
The study by Le Nhu Nga and colleagues concludes: with the right data, the right workflow, and the right hydrological units, GeoAI does more than draw maps, it enables evidence-based disaster-risk policy aligned with current legal and technical frameworks, and scalable to other mountainous provinces in Vietnam.
From this point on, each rainy season need not be a test of luck, but a risk-management challenge with actionable solutions—rooted in maps, data, and informed decisions.
Viet Anh
Source: All data, methods, results, locations, and conclusions in this article are drawn directly from the research report: Le Nhu Nga, Le Thi Hong Van, and Trinh Thi Thu Thuy, “Development of flash-flood hazard maps for the Northern communes of Tuyen Quang province (Former Ha Giang province) using Geospatial Artificial Intelligence,” Institute of Mechanics, Vietnam Academy of Science and Technology (VAST).
Post Related

Building the institutional framework for electronic land use certificates in Vietnam’s digital transformation era
Part 2: Alternate wetting and drying (AWD) - A key pathway to low-emission rice production in Vietnam

Part 1: Water use efficiency - The foundation of Vietnam’s green agricultural transition

Gravity-driven water filtration system: A new hope for flood-affected communities

Vietnam - South Korea strengthen cooperation on digital transformation in the water sector

Vietnam to host AWC 2025: Toward sustainable water governance and digital transformation

Vietnam and Australia cooperate to advance the circular economy and sustainable agriculture

Vietnam and Queensland advance agricultural cooperation toward sustainability and trade balance